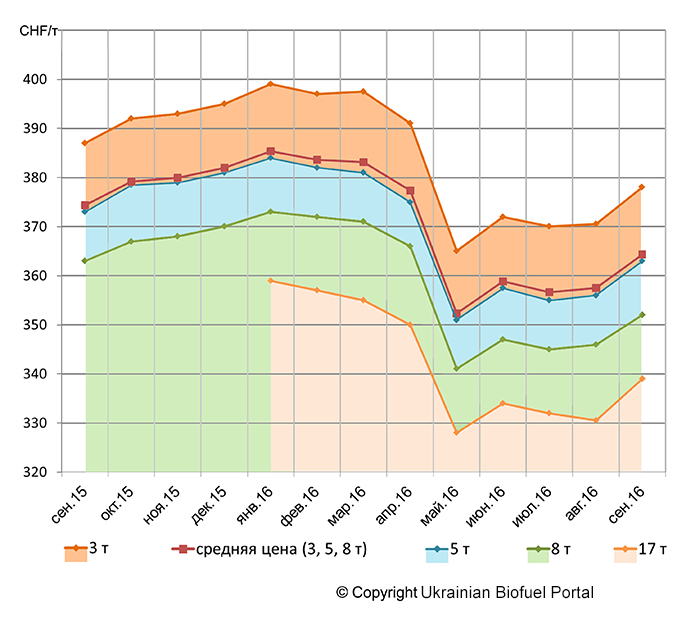
In September 2016 after summer decrease, the price index for wood pellets in Switzerland featured the seasonal growth. Depending on the lot the average price of Swiss pellets in the middle of September amounted (per ton):
The above-stated data cannot indicate that the pellet market in Switzerland has been returned to steady track after high volatility in 2015 and nine months of 2016.
The decision of the Swiss National Bank (SNB) regarding the suspension of keeping a minimum exchange rate at the level of 1.20 CHF per one EUR starting from January 15, 2015 had a shocking impact on pellet prices in 2015. It caused sharp strengthening of national currency of Switzerland. For the first time the CHF was more expensive than EUR. On January 23, 2015, one EUR cost 0.9816 CHF. Domestic prices for pellets increased dramatically and in February 2015 they reached 409.2 CHF/t (or 391.32 EUR/t), being higher than the prices in January (344.40 EUR/t) for 14%.
After the sharp raising in January – February the prices were back to their regular trend for season consumption – demand reduction and decrease in prices starting from the end of spring and in summer prior to increase in prices starting from September until late winter.
Figure 1. Prices for Swiss pellets in CHF per ton, September 2015 – September 2016
It was going smoothly pertaining to CHF prices at the beginning of 2016, without shocking price situation taken place last winter. The year started as usually from winter price increase and repeated the trend being specific for season consumption of pellets in Switzerland (see the Figure 1).

However, the average level of prices in September 2016 in CHF was lower for 2.8% than in September 2015 when the average price of pellets of ENplus A1 quality amounted 375.10 CHF/t (342.60 EUR/t). In 2016 the prices for pellets in EUR were fluctuating, the same was in 2015. Cross rate EUR/CHF was continuing to have impact on the price volatility.
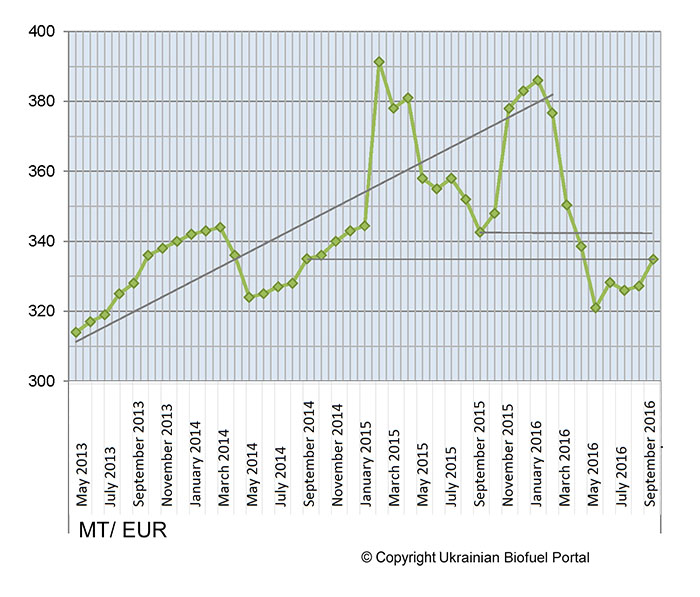
Figure 2. The average price for wood pellets in Switzerland upon average monthly exchange rate of the European Central Bank (ECB), €/t. Source: data of Bundesamt für Statistik (BFS).
At Figure 2, there are prices in EUR in Switzerland starting from May 2013 until September 2016. Until late March 2016, the trend line shows the tendency for all last years – growth of average prices on wood pellets in EUR. However, pellet prices in EUR as of September 14, 2016 are now lower than the prices in September 2015 by 2.33% and meet the level of prices in September 2014. Moreover, it is still early to speak about trend reversal prior to exchange rate stabilization.
Based on statistics of timber industry of Switzerland in 2015 of the Federal Department of Environment, Transport, Energy and Communications (Eidgenössisches Departement für Umwelt, Verkehr, Energie und Kommunikation, UVEK) and the Swiss Federal Office of Statistics (Bundesamt für Statistik, BFS), the strengthening of CHF in relation to EUR caused the decline of general volumes of timber logging almost by 7%. In 2015 in Switzerland, energy timber was logged by 4% less than earlier, as well as for pellet production. Nevertheless, the strengthening of CHF had a positive impact on the profitability of the industry. The local prices in national currency for the product made of timber diminished the growth in 2016 and became more attractive for end-users within the country.
The overall volume of the Swiss production of wood pellets for the last five years has been increasing approximately by 5% per year, comprising 160000 tons in 2015 that is higher than the indices specified in the EU programme pertaining to consumption decrease of mineral fuel until 2020. Switzerland has joined the programme.
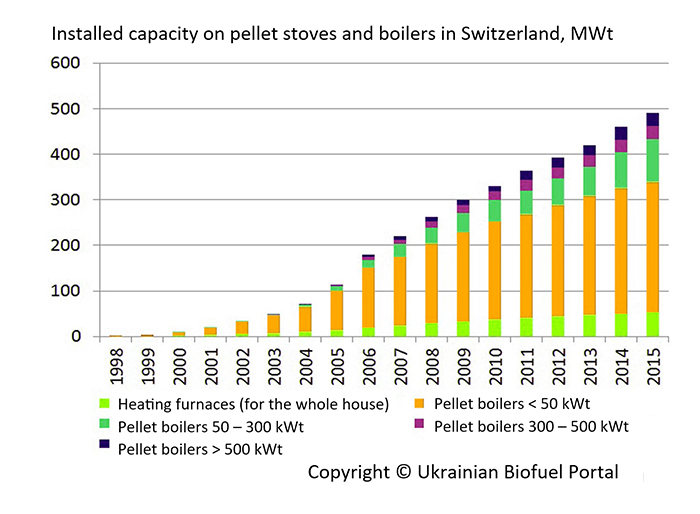
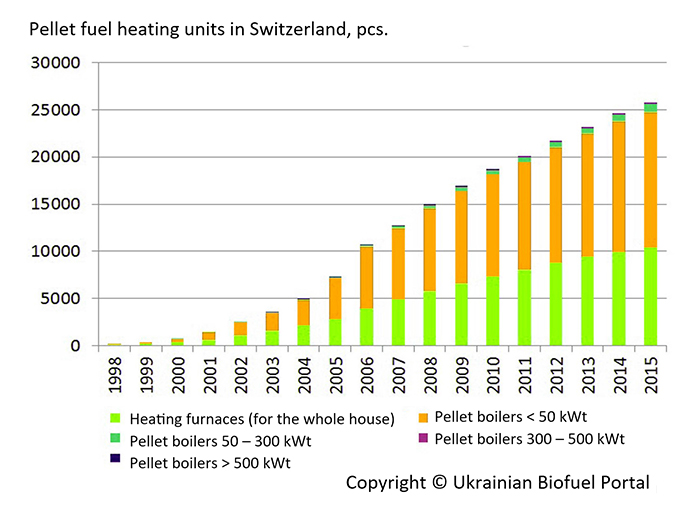
Almost all wood pellets produced in Switzerland are for domestic market, most of them are consumed in private sector (>80%). On the Drawings 3 and 4, there is a growth of the entire installed power capacity (MW) and the quantity of pellet installations (pcs) in Switzerland from 1998 to 2015. The data upon heating stoves (for heating the whole building) and pellet boilers of low power capacity (<50kW) used in households are depicted in bright green and orange colors.

Figure 3. Increase of installed power capacity on pellet stoves and boilers in Switzerland, kW. Source: Bundesamt für Energie (BFE)

Figure 4. Increase of the quantity of heating on pellet fuel in Switzerland, pcs. Source: Bundesamt für Energie (BFE)
Pellet prices in Switzerland are approximately by 31 – 33% higher than in neighboring Germany and Austria. Switzerland continues to import the fuel. There is a steady correlation of domestic prices in Switzerland with export prices in Germany and Austria. The main supplier is Germany; slightly less is imported from Austria. However, it should be taken into consideration that the pellets delivered from Germany can have Eastern European origin – Germany carries out re-export of the pellets meeting the standard SN 166000 from Slovakia, Czech Republic, Poland, Republic of Belarus, Ukraine, etc.
| Switzerland: Wood Pellet Price Index, CHF/T | Comparison Basis: December 2015 | Source: Swiss Federal Office of Statistics (Bundesamt für Statistik, BFS) | ||||||||||
| Jan. | Feb. | Mar. | Apr. | May | June | July | Aug. | Sept. | Oct. | Nov. | Dec. | |
| 2005 | 84,09 | 84,62 | 84,62 | 84,62 | 84,69 | 84,69 | 84,69 | 84,87 | 84,87 | 84,87 | 86,34 | 86,34 |
| 2006 | 86,34 | 86,34 | 86,34 | 89,53 | 89,53 | 89,53 | 89,53 | 89,53 | 89,53 | 100,68 | 100,68 | 100,68 |
| 2007 | 100,68 | 100,68 | 100,68 | 106,32 | 106,32 | 106,32 | 106,32 | 106,32 | 106,32 | 100,05 | 100,05 | 100,05 |
| 2008 | 103,00 | 101,68 | 101,31 | 96,79 | 93,91 | 92,76 | 91,15 | 91,98 | 97,06 | 98,85 | 99,34 | 100,49 |
| 2009 | 103,30 | 105,34 | 105,35 | 103,75 | 98,25 | 98,67 | 98,17 | 101,32 | 102,14 | 106,12 | 106,62 | 108,06 |
| 2010 | 108,97 | 109,02 | 108,34 | 106,37 | 101,07 | 101,73 | 102,45 | 104,42 | 105,69 | 108,37 | 109,15 | 109,67 |
| 2011 | 110,80 | 110,76 | 110,82 | 108,28 | 102,88 | 103,30 | 102,65 | 101,18 | 100,98 | 101,30 | 101,38 | 102,55 |
| 2012 | 102,18 | 103,07 | 102,84 | 98,84 | 95,85 | 96,77 | 96,71 | 97,27 | 97,51 | 99,41 | 99,84 | 102,10 |
| 2013 | 103,91 | 106,67 | 107,68 | 106,73 | 103,43 | 104,06 | 104,28 | 105,00 | 105,89 | 109,17 | 110,03 | 110,62 |
| 2014 | 111,24 | 111,12 | 110,14 | 107,27 | 103,60 | 103,87 | 104,01 | 104,91 | 105,82 | 107,06 | 107,71 | 108,63 |
| 2015 | 108,64 | 108,32 | 104,94 | 102,93 | 97,80 | 96,40 | 96,21 | 96,68 | 97,96 | 98,74 | 99,33 | 100,00 |
| 2016 | 100,80 | 100,53 | 99,88 | 88,39 | 83,81 | 85,70 | 85,11 | 85,43 | 87,43 | |||
Table. Wood Pellets Price index in Switzerland, CHF/t.
Switzerland: Wood Pellets Price index in Switzerland, CHF/t Basic information for comparison: December 2015. Source: data of the Swiss Federal Office of Statistics (Bundesamt für Statistik, BFS)
Figure 5. Pellet Average Prices Change in Switzerland, %, up to the basic level (December 2015 – 100%).
In view of national production safety in Switzerland there have introduced import duties wood pellets at the level 8%. As for wood processing industry within "Schweizerholz Initiatives" there have defined objectives in terms of initiating the growth of domestic consumption of products made of Swiss timber for 2 – 3 mln cub. m per year.
The citizens who wish to transfer their heating system from mineral fuel and gas into timber (fire wood and wood pellets) receive financial assistance, as well as engineering and technical support within the social initiative NGO "Holzenergie Schweiz". Nevertheless, in Switzerland there is now a very low excise duty on residual fuel oil (0.003 CHF per liter) that rather restraints the growth of wood pellet consumption within general decrease of prices for oil products.
The efforts of NGO "Holzenergie Schweiz" in support of pellet usage in households have positive effect. With the increase of heating appliances for households the price index calculated in CHF according to BFS data for the period 2005 – September 2016 (see the Table) has showed the steady decrease of average prices on pellets. Average retail prices on fuel in CHF are taken for the report basis in December 2015 - 6 tons for the lot.
The figure of average price indices (see the Figure 5) based on the table data shows the overall trend for last years – the reversal starting from 2011 – 2012, as well as decrease of wood pellet prices in Switzerland. The purpose is to equal local prices with payment for import pellets.